In today’s technology-driven world, systems monitoring plays a crucial role in ensuring reliability and performance. One of the most popular tools for monitoring is Prometheus—an open-source monitoring and alerting toolkit originally developed by SoundCloud. It is widely used to collect and analyze metrics from various systems and services. Prometheus is known for its powerful query language (PromQL), multidimensional data model, and seamless integration with other tools like Grafana. For students and IT professionals trying to understand Prometheus, getting proper guidance through Prometheus Monitoring assignment help with platforms like BookMyEssay under My Assignment Help can be extremely beneficial.
What is Prometheus?
Prometheus is a robust, open-source systems monitoring and alerting tool that works primarily with time-series data. This means it stores data as a sequence of time stamped values that change over time, making it ideal for tracking CPU usage, memory consumption, application health, and more.
Unlike traditional monitoring tools, Prometheus uses a pull-based approach. It scrapes metrics data from configured targets at given intervals and stores them locally. This method is highly scalable and flexible, allowing users to monitor thousands of endpoints without overwhelming the system.
Key Features of Prometheus
Prometheus offers several standout features that make it ideal for modern infrastructure monitoring:
- Multidimensional Data Model: Uses metric names and key-value pairs (labels) to define time-series data.
- PromQL (Prometheus Query Language): A powerful language for querying and filtering data.
- No External Storage Dependency: Prometheus is standalone and doesn't require remote storage to function.
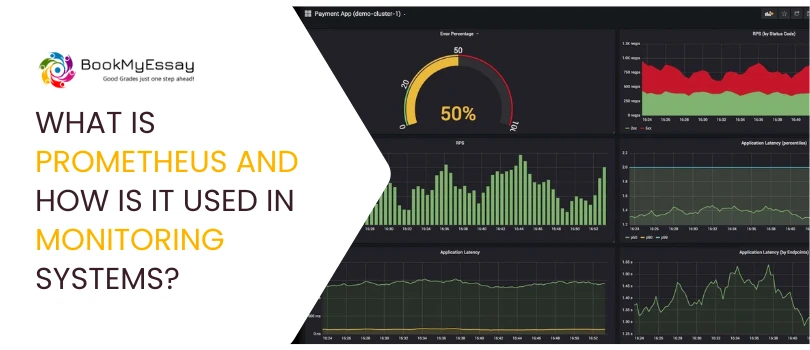
- Visualization: Easily integrates with tools like Grafana for creating dynamic dashboards.
- Alerting: Includes an integrated Alertmanager to handle alerts and send notifications via email, Slack, etc.
How Prometheus Is Used in Monitoring Systems
Prometheus is widely adopted in DevOps environments for its flexibility and efficiency. Here’s how it is commonly used:
- Infrastructure Monitoring: Prometheus monitors servers, containers, and network resources in real-time. Metrics like CPU, RAM, disk space, and bandwidth usage are continuously recorded.
- Application Performance Monitoring (APM): Developers use Prometheus to track response times, request rates, and error rates, helping diagnose performance bottlenecks in applications.
- Service-Level Monitoring: Prometheus helps ensure that services meet performance standards or SLAs (Service-Level Agreements).
- Alerting and Incident Response: When metrics cross predefined thresholds, Prometheus can trigger alerts via Alertmanager, enabling quick response to potential issues.
Why Choose Prometheus Monitoring Assignment Help from BookMyEssay?
Understanding how Prometheus works can be challenging due to its technical depth. That’s where Prometheus Monitoring assignment help from BookMyEssay comes in. Their team of IT experts offers personalized guidance, step-by-step explanations, and real-world examples to make complex concepts easier.
Whether you’re stuck with PromQL queries, architecture design, or integration tasks, BookMyEssay My Assignment Help platform provides reliable academic support. You get original, plagiarism-free assignments delivered on time, helping you score better and learn faster.
Final Thoughts
Prometheus is a game-changer in modern monitoring systems. Its powerful features and community support make it an essential tool for developers and system admins. For students looking to master it, Prometheus Monitoring assignment help from BookMyEssay My Assignment Help service can make a big difference in academic success and practical learning.


 3 Bellbridge Dr, Hoppers Crossing, Melbourne VIC 3029


